


The Tale of Two Energy Transitions
The transition which never was and the shift in the balance of power

The 2025 issue of the Statistical Review of World Energy was released last week, complete with a treasure trove of data from 2014 to 2024. Since I’ve found the charts provided with the report extremely unhelpful to get the big picture, I set out to analyze the data myself… And boy, what a difference a wider boundary approach can make! Especially, when it comes to understanding decadal trends such as the elusive “energy transition” or the very real transition of power from the Western hemisphere to the East. If you thought that an 87% global share of fossil fuels was high, or that at least we were making progress, then I urge you to think again. On the other hand if you were wondering why things fall apart in the West, look no further for an answer.
Thank you for reading The Honest Sorcerer. If you value this article or any others please share and consider a subscription, or perhaps buying a virtual coffee… At the same time let me express my eternal gratitude to those already support my work — without you this site could not exist.

Introduction
Let’s start by stating that in 2024 energy was still the economy. It always was and always will be. There is no economic activity without energy expenditure. From hair saloons using electricity to restaurants cooking with natural gas — or from agriculture, mining and transportation powered by diesel fuel to metallurgy and cement manufacturing enabled by coal — every monetary transaction in the economy generated a great deal of energy consumption. Without an exception. And while some could argue that western states moved past industrial scale energy use by transforming into “service economies”, these societies still consume steel, concrete, plastics, glass, microelectronics, paper, food etc. — all made by burning tons of fuel elsewhere. Viewed from a global perspective, globalization has just moved the location of factories and mines, but did not make any economy on the planet more sustainable, more energy efficient, more green or more advanced. In fact, I argue, all what we have achieved with this shuffling of production around the globe was an even faster draw-down of Earth’s one time resource inheritance.
So, how do we measure this vast energy expenditure when it comes to our one global economy? The guys and gals at the Energy Institute producing the Statistical Review of World Energy report chose to use exajoules (EJ) as their yardstick to measure energy from coal, oil and gas and Terawatts to measure the power produced by windmills, solar panels, nuclear and hydro. But what and how much is an exajoule, anyway? Well, in a nutshell it’s a lot — okay, an awful lot of energy. Let’s say you want to make pasta tonight. In order to bring 1 liter (or a little more than a quart) of water to boil from room temperature, you would need 334,720 joules of energy — which might sound like a lot if you are not used to work with large numbers. However, this figure dwarfs in comparison to one exajoule, or 1 quintillion joules (that is, 1 followed by 18 zeros). Folks, that’s enough energy to bring an entire lake (holding roughly 3 cubic kilometers of water) to boil. Together with the fish. And that’s just 1 exajoule (1). In 2024 alone we, as a species, have released 513 EJ of energy from fossil fuels alone; almost enough to bring the equivalent of the entire Lake Ontario to boil, from top to bottom… Now, go back to the kitchen, and check your pasta before it boils over. And while at it, imagine how many times you could fill your cooking pot from the fourth largest lake in North America. Bon appetit.

The Energy Transition That Never Was
According to the latest numbers compiled in the report, 87% of the energy used by humanity in 2024 came from fossil fuels. The remaining 13% was consumed in the form of electricity from nuclear, hydro and other “renewables”. Based on these numbers, however, we barely moved the needle in the past ten years, at least when it comes to the much taunted “energy transition”. Coal, oil and gas catered for just a little more than 89% of all energy supply a decade ago! At this rate of “decarbonization”, fossil fuels would be still responsible for almost 80% of our energy consumption in 2050. Heck, if I may venture a guess, we will run out of coal, oil and gas far faster than we could replace just a half of them with solar panels and wind turbines. (2)

There is a mighty big caveat here, as even that 87% cited above is a gross underestimation of our reliance on fossil fuels. In a nutshell: if you thought that an 87% global share of fossil fuels was based on actual energy output, then hurry, because these folks at the Energy Institute have a mighty big bridge to sell you. In order to show progress (even as meager as we’ve seen above), and to make investors think that these “alternative” sources of energy are somehow a viable replacement to fossil fuels (which they’re demonstrably not), a statistical slight of hand had to be used. This meant that low-carbon energy sources were accounted for the amount of fossil heat they replaced, not for the actual electricity they provided to the system. Truth to be told, the authors of the report tell us as much, although in small print at the bottom of the page (emphasis mine):
“Energy from non-fossil fuel combustible electricity generation is accounted for on their input heat requirements and non-combustible renewables on the energy content of their gross electrical output.”
Our total energy consumption was thus artificially inflated to show low-carbon energy sources in a much better light, assigning them a much bigger share of world energy production than they actually represent. This is how we get figures for nuclear three times as large than in real life — accounting for the heat produced by uranium, not for the electricity provided to the grid. (3) So while hydro is represented more-or-less correctly (there is no heat to electricity conversion going on there), so called “renewables” receive a similar beauty treatment to nuclear (4).
According to the report the world has avoided using 1,371 EJ of fossil fuels through renewables and nuclear since 2010. The authors somehow forget to mention that mines mining silica and uranium ore still operate on natural gas and diesel powered equipment to this very day… Not to mention the fact that the ores from which silicon panels and steel structures are made from are smelted using coal, and that the whole edifice is supported by a plethora of diesel powered vehicles from ships to trucks and cranes. That, apparently, all doesn’t matter. All that matters is how much fossil fuels these unsustainable sources of electricity supply replaced — as if these technologies were a gift from outer space teleported to Earth at no cost.

Meanwhile the share of electricity consumption out of total energy use remained steady around 20%, with very little difference between OECD and non-OECD countries (20.7% vs 19.6%). Truth to be told the share of low carbon sources (especially hydro and “renewables”) kept increasing over the years, reaching a commendable 41% on a per kilowatt basis. (Again, we are talking about a fraction of a fraction here: 41% of 20% i.e. 8% of world energy supply.) That trend, however, has only exposed the two Achilles heels of complex systems, resulting in a tightly coupled, vulnerable electric grid reaching Byzantine levels of complexity. All the while, it did nothing to reduce our dependence on fossil fuels, just optimized their consumption.
Seeing the relentless increase in fossil fuel consumption year after year, and the snail’s pace with which low-carbon energy increases its share of world energy, one cannot help but wonder: aren’t we just shuffling the deck-chairs on the Titanic…? Is further electrification possible, let alone desirable? In case of the US electric grid, for example, a whopping 59% of the energy fed into the system by power plants gets wasted as transmission and conversion losses. (Just take a look at that black box at the bottom of the chart below, the one which sucks in more power than it was provided by coal and nuclear together.)

I’m not saying that fossil fuels are good in any way. These energy sources, too, come with their own losses and inefficiencies (plus pollution). Making the audience of this report — decision makers, politicians, company board members — believe that our energy system is cleaner than it actually is or that “renewables” are that much more efficient, is still a lie, though. When it comes to operating a national, let alone world wide energy system we must take a more honest approach. Who do we want to fool, anyway? We know that the economy depends on fossil fuels in every critical area. Cement. Steel. Fertilizers. Plastics. Agriculture. Mining. Metallurgy. Glass. None of these would be possible at present scale (if at all!) without coal oil and natural gas — all of which is found in finite and rapidly depleting reserves. So, here is how an honest assessment of the world energy system based on actual, usable inputs would look like:

What we should do instead of chasing the illusory white rabbit of the “energy transition” is to acknowledge how much we depend on fossils for our economic survival and how much fuel we still have in the tank, then engineer a slow and equitable power down of this high-tech civilization. Yes, that would mean a relentless decrease in economic output, job losses and a ton of things needed to be reorganized. Since that’s not gonna help them win any elections, our economic and political elite decided to keep pretending that all is fine and that we are making progress.
The Real Energy Transition
There is, however, a real energy transition going on in the world as we speak, unlike the illusory one depicted above. It is the transition of economic and political power from the Collective West (OECD countries) to the rapidly industrializing and electrifying nations of Asia, especially China. The chart below, tells it all:

What you see above is the cumulative change in total energy supply compared to 2014. According to the data from the report, and as illustrated by the graph above, OECD countries in 2024 used 3% less energy than in 2014. Meanwhile their GDP grew from 52 trillion USD in 2014 to 81 trillion in 2023 (last year’s data is not yet available). The two doesn’t add up, however. Pray tell, how on Earth could an economic bloc’s gross domestic product grow by 56% in 9 years, while their energy use actually shrank by 3%? Don’t tell me that we got that much more energy efficient… Our trucks, ships, cars, smelters, power plants, factories operate on mature technologies, developed and perfected decades ago as I explained here already. The only way to materially grow the economy is to invest in more capacity, or spending more on energy intensive services. In fact, as we have seen in the past three years, quite the opposite has happened.
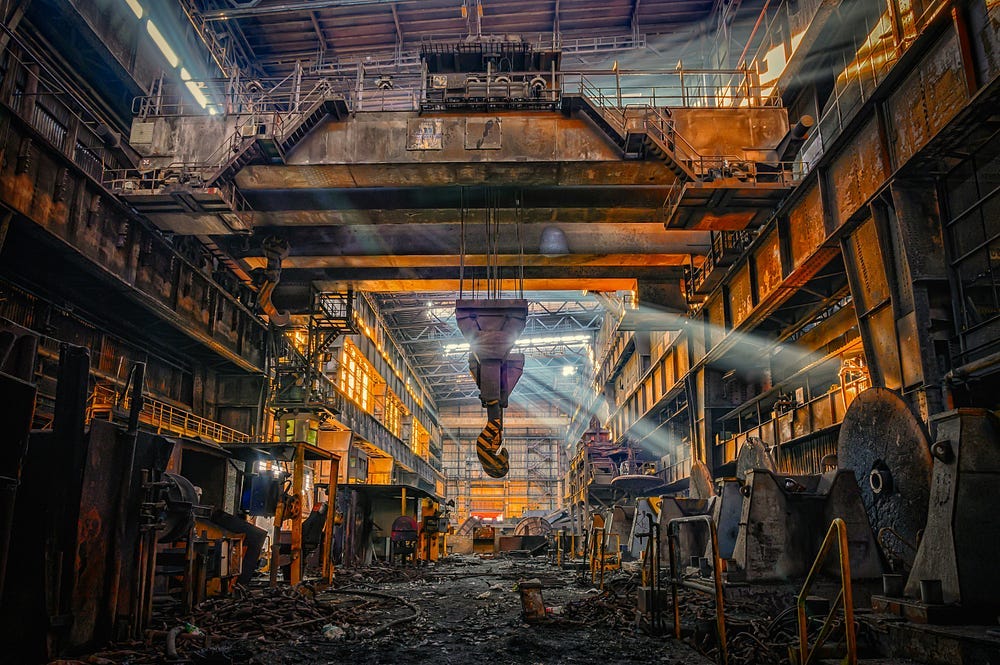
Deindustrialization has gained momentum, leaving Europe in an especially bad situation. Plants are closing doors and moving elsewhere. And if plants move, their suppliers and service providers move, too, triggering a slow, cascading collapse across the entire economy. That naturally translates into lower tax revenue, leading to increased government borrowing. The loss of local manufacturing of fertilizer made from natural gas in Europe, for example, has led to importing essential products at a much higher price, leading to a widespread increase in consumer prices all across the board. As a result consumers now have much less to spend on services and other discretionary items, leading to another drop in production; this time in car factories. That however, automatically triggers lower steel consumption and another round of plant closures. Rinse and repeat, till you find yourself consuming 10% less energy than ten years ago in a hollowed out economy looking increasingly like a Jenga tower. Due to this loss of supply chain network connection, not to mention access to affordable fossil fuels, de-industrialization is a slippery slope. By the time the ride begins in earnest, it has already become virtually impossible to stop.
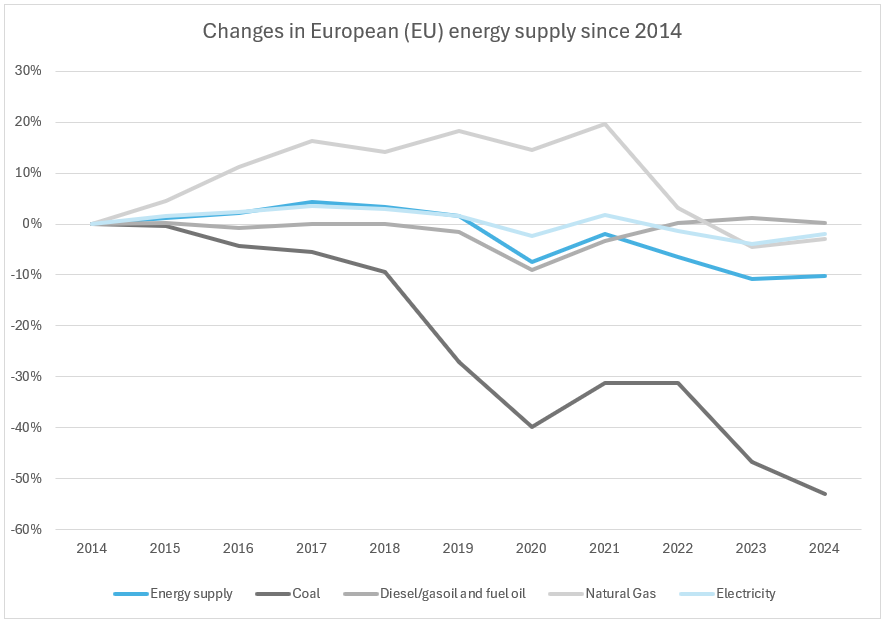
All that is illustrated on the chart above. The massive amounts of pipeline gas added to the network since 2014 has kept Europe well fed with energy despite a rapid decline in the coal sector to maintain at least a modicum of growth. That changed, however in 2022, when not only natural gas deliveries were made impossible by EU policies, but an outright ban on Russian coal came into force — further accelerating the fall in coal consumption in the old continent. Contrary to common beliefs, that decline was not entirely due to the switch to natural gas and renewables in electricity generation. The EU used to be a large steel producer, but as coal extraction became costlier year-after-year in Europe (as rich deposits depleted and miners had to dig deeper and deeper) the continent’s steel makers have lost their competitive edge and relied ever more on coal imports. And now, with the banning of imports from the closest supply and de-industrialization in full swing as automotive companies shutting down one production line after the other, demand has fallen off the cliff as well. Europe’s coal consumption was halved in a decade as a result, leading to a fall in CO2 emissions at the cost of a permanent loss of real economic output.
The illusion of economic growth has to be maintained, though, literally at all costs. If that means still more borrowing for consumers, companies and governments alike, then so be it. This is a dangerous path, though. Without an underlying increase in material throughput, this type of growth is nothing but a bubble, an economic disaster waiting to happen on both sides of the Atlantic. The entire OECD group is suffering from a lack of meaningful growth at least since a decade now, yet it saw it’s GDP rise by more than a half. Healthy economies experience the opposite under such circumstances: a decline in monetary transactions and a genuine reorganization of the economy. That didn’t happen in the Collective West, though. This lack of real growth, together with the over-financialization of the economy, is what makes all debts impossible to repay, and this is why the implosion of OECD financial markets stuffed chuck full of credit and derivatives has now become a virtual certainty. Again, this was decades in the making, and by the time our wise betters and elders realized that we are in trouble deep, the ride downhill has already become impossible to stop.
The rest of the world, on the other hand has increased its energy throughput by a whopping 26%, corresponding to a 2.3% year-over-year growth over the past decade. Make no mistake, I’m not saying that this is sustainable, but at least it is happening. Knowing that we are still 91% reliant on fossil fuels, and the remaining 9% heavily depends on the availability of coal, oil and gas, we are on an utterly unsustainable trajectory. Until a peak in non-OECD energy consumption comes, however, the balance of power will continue to shift eastwards, with China, Russia, India gaining strength and Europe sinking into irrelevancy, while the US topples over as it passes its own peak oil supply and loses its financial world hegemony at the same time.
Conclusion
It takes energy to produce anything: from war planes to flower pots, everything in the economy hinges on the supply of energy. If that supply begins to shrink or stagnate, that means that the economy has entered a zero-sum game where companies and even national economies have to die in order for other firms and countries to live. And since we are seven years past world peak crude oil output, the world itself has entered a game of musical chairs. The EU has tossed its chair out the window, and now mumbles and stumbles towards the edge of the room. The US stagnates and holds onto his chair like a mad dog gripping its favorite pair of slippers. The rest of the world still enjoys some real economic growth, but that’s bound to end soon, as all easy-to-get deposits of fossil fuels deplete and get increasingly replaced by more energy intensive to get resources. How this shift in the balance of power will unfold is anyone’s guess, but one thing seems to be sure: we will consume a lot of energy to make all that popcorn before the curtain finally falls.
Until next time,
B
Thank you for reading The Honest Sorcerer. If you value this article or any others please share and consider a subscription, or perhaps buying a virtual coffee… At the same time let me express my eternal gratitude to those already support my work — without you this site could not exist.
Notes:
(1) Another way to visualize this enormous amount of energy release from fossil fuels alone, is to convert their energy into Megatons of TNT equivalent (1 exajoule equals 239 Megatons of TNT). The 513 EJ of energy released from fossil fuels in 2024 was thus the equivalent of 122,607 Mt of energy, or a 50 Mt Tsar-bomb detonated every three and half hours, every day of the year. And, mind you, we are doing this at a similar rate for decades now… As a result we released the same amount of energy as the last eruption of the Yellowstone supervolcano did in just 7 short years. If you consider the eruption of a supervolcano a civilization ending mega-catastrophe (and rightly so), the same level of energy release (and the accompanying pollution) every seven years ought to have at least some effect on the climate and biosphere, right? Sure, sure, our mighty pick-ups burn energy much cleaner than a dirty volcano, but still… A supervolcano, every freakin’ seven years?!
(2) When global gross fossil fuel output begins to decline after it’s peak later this decade, it’s share of world energy production will follow suit — even if there were no new low-carbon energy sources added. Just by maintaining our current levels of electrification, the coming fall in coal, oil and gas output will make our elites believe that they are making progress, even though the economy literally falls apart in the absence of energy.
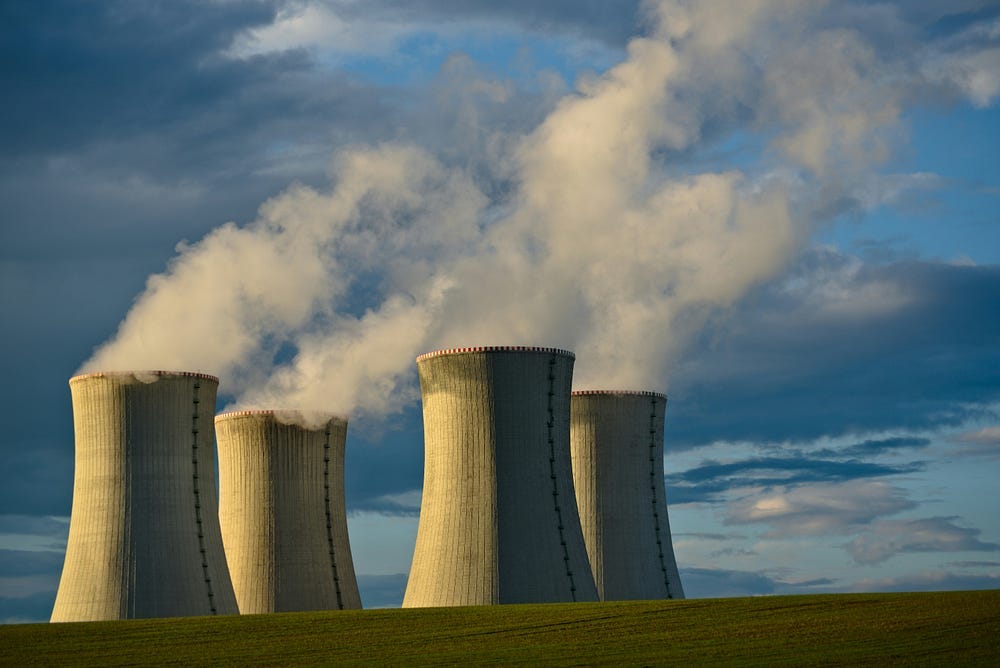
(3) The heat of the atom is used to boil water to make steam and to spin turbines, which then drive large alternating current generators. The process runs at a ~33% efficiency, which means that two-thirds of the heat produced has to be gotten rid of. And since this low-grade heat has very little industrial use — unlike heat from fossil fuels which has a gazillion applications — it all have to be released into the environment. Hence the huge cooling towers.
(4) Calculating with the actual electricity output provided by “renewable” energy found on page 62 of the report (after converting the provided Terawatt-hours to Exajoules using the 1 TWh = 0.0036 EJ formula), one gets a much lower value for “renewables” than cited on page 6, where the original doughnut chart first appeared (19 EJ vs 33 EJ). One of the reasons for that discrepancy can be an inclusion of bio-fuels (5 EJ), but that still doesn’t explain why or from where “renewables” got that additional boost of 9 EJ from… (Bio-fuel production was accounted for in thousand barrels of oil equivalent (BOE) in the report, which I had to convert into EJ with 1 BOE = 6.119 GJ and a thousand BOE = 0.000006119 EJ).
Plain and simple truth so carefully hidden. The confusion when food on the shelves is difficult to come by spells the breakdown of civilization, chaos, and violence.
'We need fossil fuels to live / Fossil fuels will kill us'.
The Abrahamic religions are definitely going to find many scapegoat 'Satans' before the end of this.